Today is A-level results day in the UK, when high school students find out if they've got the grades to go to university. Traditionally this is the day the media go to town to bash students or standards, depending on your view point. Students become angry that society has deemed them unworthy of the high grades they get, and society finds it hard to believe the ubiquitous A grades that are handed out are really reflective of the students' understanding.
In my mind there are two clear problems with A level results here - the grading classification itself and how students are being taught, and both these issues rear their heads in the web analytics world.
Firstly, the grading. Here in the UK A levels are marked from A to E, with a new A* grade being introduced this year to try and distinguish the really bright students from the bright ones. However, as more and more students receive the better grades as the years pass, it becomes hard to distinguish the brighter students from the bright - the metric isn't transparent. This is a problem that many analysts try to overcome in their reporting. If the KPI doesn't clearly indicate what's going on, it's going to be hard to take action. Knowing that 50% of your visitors viewed 3 or more pages of your site, and are thus "engaged" doesn't help too much. Knowing the distribution of page views per visits allows you to isolate the extreme cases, and determine who's really ploughing through your site compared to those who just view three pages. In the case of A levels, replacing the grading classification with a simple % scoring system would allow universities to see a more accurate reflection of the students abilities, and compare them with others.
Secondly, metric manipulation. A common complaint is that students are being taught to pass exams, rather than being taught to broaden their knowledge of a subject. Complaints abound that first year university students are unable to string a sentence together or display an understanding of basic numeracy, but they do have a lot of A grades to their name. Back in the world of Web Analytics this manipulation often rears its head too, for example on content sites, where articles are split into multiple pages requiring the reader to click on links to view the next page, thus generating extra page views. This not only proves frustrating for the the visitor, but also implies an artificially high level of engagement with the site.
Of course KPIs are essential in the world of web analytics - they're our bread and butter. And whilst we strive to improve our sites through the monitoring of these KPIs, we need to be bear some things in mind. A KPI is useless unless it accurately depicts the outcomes you're trying to monitor. And manipulating metrics is essentially cheating. And as our Mums all told us, when you cheat, you're only cheating yourself.
Showing posts with label UK. Show all posts
Showing posts with label UK. Show all posts
Thursday, August 19, 2010

Tuesday, May 25, 2010
The Times Paywall - Not such a bad idea?
The Times of London (owner Mr R. Murdoch) recently announced it would be introducing a paywall to its two sites, due to go live at the start of June, and has been receiving a lot of coverage about it. Previous experiments with paywalls have yielded poor results, and there has been a lot of discussion, especially on social networking sites about how setting up a walled garden and attemping to work against the principle of an open internet will ultimately hurt Mr Murdoch. Furthermore, keeping content behind a paywall would not only limit the availability of the site's news, but also its reporters. Users of Twitter would no longer be able to link to their work, and see it be shared across the internet - their brand as well as their paper's would be curtailed.
Looking at it in purely monetary terms, this is clearly a beneficial move. Mr Murdoch needs to ensure that
VaCaR + PVa > VbCbR
where a denotes after and b before the paywall is introduced, V is the number of visitors, C the display ad clickthrough rate, R the revenue per click, and P the subscription price.
Making some assumptions about the share of visits to visitors before and after the paywall change, taking the visitor values for The Times with the forecast 95% fall in traffic afterwards, and assuming that the clickthrough rate will improve following the introduction of a paywall suggests that unless revenue per click is more than approximately £26, this will generate more revenue for News Corp. This demonstrates that this move will clearly benefit them (unless anyone knows of an ad that regularly yields that sort of revenue per click!). Of course the cost to the brand in terms of damaged reputation, reduced visability and possible loss of staff is not so easy to calculate.
In terms of analytics, though, things get more interesting. Reducing the amount of traffic to the site in this way should tighten the audience profile - effectively removing the drifters, and bringing the online profile of visitors closer to the offline one. This then should enable more effective advertising, appealing to the more shared interests of the new profile. Also, the new traffic should be more engaged with the site, generating more page views per visit, and thus more opportunity for clicking on the ads, as well as helping any behavioural advertising the company may be using. And of course in terms of the site itself rather than the advertising, the more engaged traffic should improve the conversion funnels the site has, such as engaging with their live chat facility.
I'll be interested to hear what News Corp has to say about the effects of its paywall from this perspective in a month or so!
Looking at it in purely monetary terms, this is clearly a beneficial move. Mr Murdoch needs to ensure that
VaCaR + PVa > VbCbR
where a denotes after and b before the paywall is introduced, V is the number of visitors, C the display ad clickthrough rate, R the revenue per click, and P the subscription price.
Making some assumptions about the share of visits to visitors before and after the paywall change, taking the visitor values for The Times with the forecast 95% fall in traffic afterwards, and assuming that the clickthrough rate will improve following the introduction of a paywall suggests that unless revenue per click is more than approximately £26, this will generate more revenue for News Corp. This demonstrates that this move will clearly benefit them (unless anyone knows of an ad that regularly yields that sort of revenue per click!). Of course the cost to the brand in terms of damaged reputation, reduced visability and possible loss of staff is not so easy to calculate.
In terms of analytics, though, things get more interesting. Reducing the amount of traffic to the site in this way should tighten the audience profile - effectively removing the drifters, and bringing the online profile of visitors closer to the offline one. This then should enable more effective advertising, appealing to the more shared interests of the new profile. Also, the new traffic should be more engaged with the site, generating more page views per visit, and thus more opportunity for clicking on the ads, as well as helping any behavioural advertising the company may be using. And of course in terms of the site itself rather than the advertising, the more engaged traffic should improve the conversion funnels the site has, such as engaging with their live chat facility.
I'll be interested to hear what News Corp has to say about the effects of its paywall from this perspective in a month or so!
Monday, May 24, 2010
Education in web analytics: Teaching kids how to measure the internet proper
Following my previous post on education for those in the web analytics industry, I thought I'd have a look at the opportunites for those still in full-time education to develop the skills to enter the industry.
Recent events have encouraged me to take a more active interest in the education system, and although I'd never encourage my children to follow my career just for the sake of it, I've been thinking about which courses I would recommend to a student to develop the necessary skills and knowledge to be a success in the digital measurement industry. In my opinion, there are two sides to this. The first is a generic internet education, which I would hope would be included in the "standard" ICT courses (for those in the UK) up-to and including GCSE level.
Delving into the internet section of an ICT course, children would need to be made aware of general internet skills. Being taught about the privacy and safety implications of using the internet should be as important as the Green Cross Code. I would also consider a basic understanding of how websites are built, covering coding and infrastructure to be an important part of any ICT course. Then, more specifically related to the web analytics area, a discussion of the way sites are tracked; rather than looking at it from the standard "all tracking is evil and intrusive" perspective, considering why businesses do it, and how it could be beneficial to the customer when executed correctly. One would also hope this would also be covered in any Business Studies course available today. Finally, it would be desirable if they covered internet terminology so that once and for all people could distinguish between visits and hits! Obviously these topics would likely constitute a module or part of one in a larger ICT course, but imagine how much better the world would be if all youngsters were taught this...
The second of the two key areas that a student would need schooling in relates to analytical nature of the role. Assuming that the student had covered the more generic knowledge just discussed, they would then need to build on that with both further education and development. Of course, as before, there's no way that a course specifically tailored to web analytics would exist at this level, but rather the student would need a combination of broader courses to provide the more detailed knowledge required. These courses might include statistics (for obvious reasons), with a course in econometrics helping to teach them about models and statistical tests, and a course in marketing to give them the background of the problems they'll be looking to solve in the future. However, being a web analyst requires more than a knowledge of data manipulation and sales; a critical and curious mind which questions assumptions and asks the right questions is paramount. No one course can create this, but something which encourages detailed analysis and looking at an argument from multiple angles would help; perhaps philosophy or history?
Once they've got this far they'd have a good idea of the theory behind the internet, and the necessary skills set to analyse and ask questions of the data. All they'd need then is some hands-on experience of the role itself - some pre-on-the-job training. And this is where the innovative Analysis Exchange comes in, linking students, mentors and donors (non-profit and NGO websites). The mentors provide the tuition to the student, who provides a piece of analysis to a grateful charitable website. Not only does this give students a fantastic opportunity to both learn and shine, but due to the close-knit nature of the web analytics community, it gives them a great way to advertise their skills on completion of the project.
So there you go kids - that's how to get into the #measure industry. For those of you already in the industry, what would you recommend to an aspiring student?
Recent events have encouraged me to take a more active interest in the education system, and although I'd never encourage my children to follow my career just for the sake of it, I've been thinking about which courses I would recommend to a student to develop the necessary skills and knowledge to be a success in the digital measurement industry. In my opinion, there are two sides to this. The first is a generic internet education, which I would hope would be included in the "standard" ICT courses (for those in the UK) up-to and including GCSE level.
Delving into the internet section of an ICT course, children would need to be made aware of general internet skills. Being taught about the privacy and safety implications of using the internet should be as important as the Green Cross Code. I would also consider a basic understanding of how websites are built, covering coding and infrastructure to be an important part of any ICT course. Then, more specifically related to the web analytics area, a discussion of the way sites are tracked; rather than looking at it from the standard "all tracking is evil and intrusive" perspective, considering why businesses do it, and how it could be beneficial to the customer when executed correctly. One would also hope this would also be covered in any Business Studies course available today. Finally, it would be desirable if they covered internet terminology so that once and for all people could distinguish between visits and hits! Obviously these topics would likely constitute a module or part of one in a larger ICT course, but imagine how much better the world would be if all youngsters were taught this...
The second of the two key areas that a student would need schooling in relates to analytical nature of the role. Assuming that the student had covered the more generic knowledge just discussed, they would then need to build on that with both further education and development. Of course, as before, there's no way that a course specifically tailored to web analytics would exist at this level, but rather the student would need a combination of broader courses to provide the more detailed knowledge required. These courses might include statistics (for obvious reasons), with a course in econometrics helping to teach them about models and statistical tests, and a course in marketing to give them the background of the problems they'll be looking to solve in the future. However, being a web analyst requires more than a knowledge of data manipulation and sales; a critical and curious mind which questions assumptions and asks the right questions is paramount. No one course can create this, but something which encourages detailed analysis and looking at an argument from multiple angles would help; perhaps philosophy or history?
Once they've got this far they'd have a good idea of the theory behind the internet, and the necessary skills set to analyse and ask questions of the data. All they'd need then is some hands-on experience of the role itself - some pre-on-the-job training. And this is where the innovative Analysis Exchange comes in, linking students, mentors and donors (non-profit and NGO websites). The mentors provide the tuition to the student, who provides a piece of analysis to a grateful charitable website. Not only does this give students a fantastic opportunity to both learn and shine, but due to the close-knit nature of the web analytics community, it gives them a great way to advertise their skills on completion of the project.
So there you go kids - that's how to get into the #measure industry. For those of you already in the industry, what would you recommend to an aspiring student?
Wednesday, May 12, 2010
Education in web analytics: Experience vs qualifications
This is the first of a couple of posts that loosely fit under the category of education in the web analytics field. This one looks at some of the courses and qualifications out there for web analysts, and the benefits of them versus everyday experience.
There are a number of courses that are available to web analysts looking to improve their knowledge. One of the most well-known is the UBC Award of Achievement in Web Analytics. Whilst being a comprehensive course, it's geared towards people with little prior knowledge of the topic, with the first module named an "Introduction to Web Analytics". There is also an extension course, the Web Intelligence Certificate from the UBC and UC Irvine Extension, which as a prerequisite requires the UBC Award of Achievement to have been completed, and focuses on coursework.
The WAA Base Camp consists of two days of training which allows the student to get a "solid foundation of online marketing analytics knowledge and authoritative course material in a workshop environment". Unfortunately, as with a lot of WAA content, it seems to be very US-centric, with no courses available outside of North America this year, and no previous workshops outside of there since September 2008.
One complaint about why people don't join the WAA is that there's no proof of the member's quality. This has been answered by the WAA with new certification. There's been some discussion about its validity, its availability to non-WAA members and concern around pricing and how to take it - see here for an example. The WAA have responded to these in attempt to make the issue clear. There's general agreement that it's tough, with two to three years of experience required; its aim is to test your analysis skills rather than your knowledge of a particular analytics package, and it has a quasi-MBA slant to it. In a recent post Stéphane Hamel discusses the benefits of taking the test.
The Google Analytics IQ test is proving to be quite popular. So much so that they've recently had to make it tougher, raising the pass rate to 80%. Obviously this is tied to one package, and has an 18 month shelf life.
There seems to be agreement that certification is better for those earlier on in their careers. Those who've been in the industry longer have less need to demonstrate and prove their skills. However, those with experience can easily be siloed - all too often I've seen adverts for web analyst positions which talk more about the need for experience with a particular analytics package, rather than concentrating on the skills required to do the job properly. Having a qualification like the WAA certification would demonstrate your ability to bring the necessary mindset and skills to the role to successfully carry it out. The individal could show their knowledge of the technical, marketing and statistical skill sets required for this job, rather than have to spell it out on a CV. The technical knowledge one would have acquired through gaining the qualification would go a long way to helping out with any package-specific issues that may be faced in a new role.
The downside is that many of these qualifications are expensive (especially if you have to travel to take them as Steve Jackson notes in his afore-referenced blogpost). But labour economics dictates that as long as prospective employers can be assured of the quality of the test, this should only go to highlight the candidate's quality (and self-belief) - that they were willing and confident enough to invest in themselves to set themselves apart from the market. That the qualification has to be re-taken regularly for such a changing market would also demonstrate the candidate's quality.
Finally, the obligatory UK naval-gazing section. Whilst in the US where there is more knowledge about web analytics industry, here in Blighty fewer companies and managers are familiar with it. They may well be aware of what a web analyst does and how they can help provide insight and drive action etc (although possibly not to the extent a similar position in the States would), but I suspect they wouldn't be so familiar with the role of the WAA, or have any knowledge of the varying types of qualifications out there. This then, for now, lessens the impact of obtaining one of these qualifications on this side of the pond, although hopefully this will change soon.
There are a number of courses that are available to web analysts looking to improve their knowledge. One of the most well-known is the UBC Award of Achievement in Web Analytics. Whilst being a comprehensive course, it's geared towards people with little prior knowledge of the topic, with the first module named an "Introduction to Web Analytics". There is also an extension course, the Web Intelligence Certificate from the UBC and UC Irvine Extension, which as a prerequisite requires the UBC Award of Achievement to have been completed, and focuses on coursework.
The WAA Base Camp consists of two days of training which allows the student to get a "solid foundation of online marketing analytics knowledge and authoritative course material in a workshop environment". Unfortunately, as with a lot of WAA content, it seems to be very US-centric, with no courses available outside of North America this year, and no previous workshops outside of there since September 2008.
One complaint about why people don't join the WAA is that there's no proof of the member's quality. This has been answered by the WAA with new certification. There's been some discussion about its validity, its availability to non-WAA members and concern around pricing and how to take it - see here for an example. The WAA have responded to these in attempt to make the issue clear. There's general agreement that it's tough, with two to three years of experience required; its aim is to test your analysis skills rather than your knowledge of a particular analytics package, and it has a quasi-MBA slant to it. In a recent post Stéphane Hamel discusses the benefits of taking the test.
The Google Analytics IQ test is proving to be quite popular. So much so that they've recently had to make it tougher, raising the pass rate to 80%. Obviously this is tied to one package, and has an 18 month shelf life.
There seems to be agreement that certification is better for those earlier on in their careers. Those who've been in the industry longer have less need to demonstrate and prove their skills. However, those with experience can easily be siloed - all too often I've seen adverts for web analyst positions which talk more about the need for experience with a particular analytics package, rather than concentrating on the skills required to do the job properly. Having a qualification like the WAA certification would demonstrate your ability to bring the necessary mindset and skills to the role to successfully carry it out. The individal could show their knowledge of the technical, marketing and statistical skill sets required for this job, rather than have to spell it out on a CV. The technical knowledge one would have acquired through gaining the qualification would go a long way to helping out with any package-specific issues that may be faced in a new role.
The downside is that many of these qualifications are expensive (especially if you have to travel to take them as Steve Jackson notes in his afore-referenced blogpost). But labour economics dictates that as long as prospective employers can be assured of the quality of the test, this should only go to highlight the candidate's quality (and self-belief) - that they were willing and confident enough to invest in themselves to set themselves apart from the market. That the qualification has to be re-taken regularly for such a changing market would also demonstrate the candidate's quality.
Finally, the obligatory UK naval-gazing section. Whilst in the US where there is more knowledge about web analytics industry, here in Blighty fewer companies and managers are familiar with it. They may well be aware of what a web analyst does and how they can help provide insight and drive action etc (although possibly not to the extent a similar position in the States would), but I suspect they wouldn't be so familiar with the role of the WAA, or have any knowledge of the varying types of qualifications out there. This then, for now, lessens the impact of obtaining one of these qualifications on this side of the pond, although hopefully this will change soon.
Monday, May 3, 2010
The UK election - a measured perspective: Part 2
In my last post I looked at how the three parties websites were tracked, and how their Twitter social media campaigns were running.
To recap, there was little evidence of anything other than implementing the vanilla tags for Google Analytics, with no custom tracking of any sort to be seen. The three parties all had Twitter accounts, and the numbers depicted quite different levels of advancement. The Tories had the largest number of followers and also the most engaged followers according to Twitalyzer, with 100% clout and the highest influence and impact ratings of the three. The Lib Dems whilst (only just) having the smallest number of followers, had a more engaged following than Labour, with higher clout, impact and influence metrics than the governing party. Furthermore, these metrics were all still rising, indicating an campaign that is being optimised. The Labour campaign was flat-lining for impact and influence, and whilst rising for clout, was still way behind the other two parties.
The last post looked at the 30 days of data in Twitalyzer up to April 16th, effectively looking at the first half of the official campaign. This time around we look at the data in the run up to the election. This should show us how the campaigns have faired since then, and possibly give an idea of who has run the best online campaign, and how offline events have affected the online campaigns. Who knows, I may even inspire you to bet on the actual outcome should you fancy a flutter.
This time around, we look at the 30 days of data in Twitalyzer up to May 2nd, 4 days before the election. Twitalyzer uses a 30 day moving average, with the score for an account changing every 7 days. Rather than look at the levels for each week, I shall look solely at the moving average for this time period versus the last. Note also that the diagrams below use change indicators that refer to the 7 day time period just mentioned rather than that the being used for this analysis.
Before we look at the Twitalyzer numbers in detail, we'll take a quick peek at the number of followers each of the accounts has to give a very rough indication of how the parties are faring. Both the Conservative and Labour parties have seen steady growth in their follower counts, with the Conservatives growing by 11% to just shy of 30k, and Labour by 10% to 16k. The Lib Dems saw a large 38% jump in followers, taking them to almost 19k followers, and easily taking second place off Labour. This reflects the surge in popularity that Nick Clegg, the leader of the Lib Dems, has seen following his successful appearances on the Leaders Debates. Another sketchy indicator of the quality of the campaigns of each of the parties is the ratio of followers to following. Last time around both Labour and the Conservatives had fewer followers than those they followed - unrequited love? This time around things were different, with only Labour having fewer followers than those they followed. On this measure the Conservatives were the most successful, now having 7% more followers than those they followed, with the Lib Dems slipping from 5% to 1%.
To recap, in terms of Twitter followers the Conservatives remain firmly in the lead, with the massive surge in popularity for Nick Clegg not really affecting them. It has, however, propelled the Lib Dems into second place.
Turning now to the Twitalyzer numbers it can be seen that whilst there has been some change to the performance of the campaigns based on the five metrics, as with the follower data the Conservatives remain in control.

Their impact has fallen to 38.6% from the previous analysis's 40.3%, which given their increase in followers since that time period suggests this is caused by factors that have caused the influence metric to fall down to 54.1% from 58%. As you may recall, influence takes references and retweets into account, whereas clout only looks at references - given that the Tories clout score has remained at 100%, this indicates a fall in the number of retweets the Conservatives account has been receiving - whilst people are happy to mention the account, they're not so keen on spreading what the Tories have to say. However, the generosity metric for the Tories has also risen dramatically since the last analysis, to stand at 34.7%, up from 3.7%! This suggests that as well as having engaged followers (although not possibly as engaged as they were a fortnight ago) the Conservative Twitter account is now engaging better with them too, with a nearly ten times increase in the share of its tweets that reference other accounts. Inspection of the actual account reveals that this is actually retweets of accounts affiliated with the Tory campaign, so is less engagement with followers, and more spreading the message.
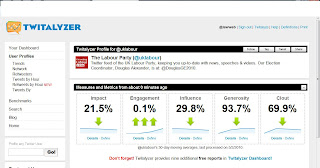
The Labour party have been having a poor campaign offline, and this appears to be the case online as well. With the exception of generosity, all their metrics fell between the two time periods. Given that this presumably takes into account the 10% growth in followers, this indicates a marked fall in follower engagement, and suggests that the message that the Labour account is delivering isn't inspiring people enough to spread it. As with the previous period, all the follower engagement metrics for the Labour account are lower than both the Tory and Lib Dem accounts, and are now becoming more so. It is hard to determine the effect of Gordon Brown's gaffe late last week where he accused a member of the public of being "bigoted" on the Twitter account performance, given the seven day time periods used by Twitalyzer and the dates used here for the Twitter follower count, but it is improbable that this is the main cause of the downturn in their performance as this began before the gaffe. Although it can't be proved, it does appear that this specific event has not had the large negative effect on Labour's Twitter campaign that Nick Clegg's positive performance had on his party's campaign. This one-way relationship (if it exists) could give us some limited insight into the type of follower the social media campaigns have - being more positively affected by the campaign it suggests that party account followers are more affiliated with their party than the typical member of the public (as one would expect).

The Lib Dem Twitter account has seen a slight increase in impact, rising to 32.6% from 30.5% a fortnight ago. This reflects the large increase in followers, and will have been held back by the smaller increase in its follower engagement, represented here by the influence metric which only rose from 45.9% to 47.1%. The clout metric actually fell between the two periods, from 97.7% to 92.5%. This indicates an increase in the number of retweets, but a fall in references, suggesting that the new followers that the account has received (probably off the back of Nick Clegg's TV performances) are happy to retweet its message, but less likely to engage directly with the account.
It would appear then that the Labour account has deteriorated since the last analysis, when it wasn't performing well anyway, and is clearly behind the other two parties. The Lib Dems, whilst seeing a large increase in followers, and improvements in its influence, engagement and impact metrics, has seen a fall in its generosity and clout metrics, indicating an increase in the number of retweets as well as other accounts that it references, but fall in references by others. Whilst the Tory campaign has deteriorated since the last analysis, with both the impact and influence metrics falling, indicating a fall in their tweets being retweeted, they are still spreading their message more effectively than the other parties. Traditionally the Tories have had a stronger online presence than the other main parties, primarily in the blogosphere, and this goes some way to explaining the strength of their social media campaign.
Of course, this has only a slight correlation with the outcome of the election on Thursday, but it does show that the Conservative party have managed to generate a solid social media campaign (for Twitter) in the run up to the election, engaging better with their (larger number of) followers. Obviously, the numbers involved here are small relative to the size of the electorate, and to a certain extent their campaigns are preaching to the converted. This election will be won by convincing swing voters to vote for a party in key constituencies, and it will take more than Twitter or Facebook campaigns to do this.
Oh, and my prediction for the result? The Tories to take the largest share of the votes with a hung parliament overall. And the whole thing to begin again in under a year.
To recap, there was little evidence of anything other than implementing the vanilla tags for Google Analytics, with no custom tracking of any sort to be seen. The three parties all had Twitter accounts, and the numbers depicted quite different levels of advancement. The Tories had the largest number of followers and also the most engaged followers according to Twitalyzer, with 100% clout and the highest influence and impact ratings of the three. The Lib Dems whilst (only just) having the smallest number of followers, had a more engaged following than Labour, with higher clout, impact and influence metrics than the governing party. Furthermore, these metrics were all still rising, indicating an campaign that is being optimised. The Labour campaign was flat-lining for impact and influence, and whilst rising for clout, was still way behind the other two parties.
The last post looked at the 30 days of data in Twitalyzer up to April 16th, effectively looking at the first half of the official campaign. This time around we look at the data in the run up to the election. This should show us how the campaigns have faired since then, and possibly give an idea of who has run the best online campaign, and how offline events have affected the online campaigns. Who knows, I may even inspire you to bet on the actual outcome should you fancy a flutter.
This time around, we look at the 30 days of data in Twitalyzer up to May 2nd, 4 days before the election. Twitalyzer uses a 30 day moving average, with the score for an account changing every 7 days. Rather than look at the levels for each week, I shall look solely at the moving average for this time period versus the last. Note also that the diagrams below use change indicators that refer to the 7 day time period just mentioned rather than that the being used for this analysis.
Before we look at the Twitalyzer numbers in detail, we'll take a quick peek at the number of followers each of the accounts has to give a very rough indication of how the parties are faring. Both the Conservative and Labour parties have seen steady growth in their follower counts, with the Conservatives growing by 11% to just shy of 30k, and Labour by 10% to 16k. The Lib Dems saw a large 38% jump in followers, taking them to almost 19k followers, and easily taking second place off Labour. This reflects the surge in popularity that Nick Clegg, the leader of the Lib Dems, has seen following his successful appearances on the Leaders Debates. Another sketchy indicator of the quality of the campaigns of each of the parties is the ratio of followers to following. Last time around both Labour and the Conservatives had fewer followers than those they followed - unrequited love? This time around things were different, with only Labour having fewer followers than those they followed. On this measure the Conservatives were the most successful, now having 7% more followers than those they followed, with the Lib Dems slipping from 5% to 1%.
To recap, in terms of Twitter followers the Conservatives remain firmly in the lead, with the massive surge in popularity for Nick Clegg not really affecting them. It has, however, propelled the Lib Dems into second place.
Turning now to the Twitalyzer numbers it can be seen that whilst there has been some change to the performance of the campaigns based on the five metrics, as with the follower data the Conservatives remain in control.

Their impact has fallen to 38.6% from the previous analysis's 40.3%, which given their increase in followers since that time period suggests this is caused by factors that have caused the influence metric to fall down to 54.1% from 58%. As you may recall, influence takes references and retweets into account, whereas clout only looks at references - given that the Tories clout score has remained at 100%, this indicates a fall in the number of retweets the Conservatives account has been receiving - whilst people are happy to mention the account, they're not so keen on spreading what the Tories have to say. However, the generosity metric for the Tories has also risen dramatically since the last analysis, to stand at 34.7%, up from 3.7%! This suggests that as well as having engaged followers (although not possibly as engaged as they were a fortnight ago) the Conservative Twitter account is now engaging better with them too, with a nearly ten times increase in the share of its tweets that reference other accounts. Inspection of the actual account reveals that this is actually retweets of accounts affiliated with the Tory campaign, so is less engagement with followers, and more spreading the message.

The Labour party have been having a poor campaign offline, and this appears to be the case online as well. With the exception of generosity, all their metrics fell between the two time periods. Given that this presumably takes into account the 10% growth in followers, this indicates a marked fall in follower engagement, and suggests that the message that the Labour account is delivering isn't inspiring people enough to spread it. As with the previous period, all the follower engagement metrics for the Labour account are lower than both the Tory and Lib Dem accounts, and are now becoming more so. It is hard to determine the effect of Gordon Brown's gaffe late last week where he accused a member of the public of being "bigoted" on the Twitter account performance, given the seven day time periods used by Twitalyzer and the dates used here for the Twitter follower count, but it is improbable that this is the main cause of the downturn in their performance as this began before the gaffe. Although it can't be proved, it does appear that this specific event has not had the large negative effect on Labour's Twitter campaign that Nick Clegg's positive performance had on his party's campaign. This one-way relationship (if it exists) could give us some limited insight into the type of follower the social media campaigns have - being more positively affected by the campaign it suggests that party account followers are more affiliated with their party than the typical member of the public (as one would expect).

The Lib Dem Twitter account has seen a slight increase in impact, rising to 32.6% from 30.5% a fortnight ago. This reflects the large increase in followers, and will have been held back by the smaller increase in its follower engagement, represented here by the influence metric which only rose from 45.9% to 47.1%. The clout metric actually fell between the two periods, from 97.7% to 92.5%. This indicates an increase in the number of retweets, but a fall in references, suggesting that the new followers that the account has received (probably off the back of Nick Clegg's TV performances) are happy to retweet its message, but less likely to engage directly with the account.
It would appear then that the Labour account has deteriorated since the last analysis, when it wasn't performing well anyway, and is clearly behind the other two parties. The Lib Dems, whilst seeing a large increase in followers, and improvements in its influence, engagement and impact metrics, has seen a fall in its generosity and clout metrics, indicating an increase in the number of retweets as well as other accounts that it references, but fall in references by others. Whilst the Tory campaign has deteriorated since the last analysis, with both the impact and influence metrics falling, indicating a fall in their tweets being retweeted, they are still spreading their message more effectively than the other parties. Traditionally the Tories have had a stronger online presence than the other main parties, primarily in the blogosphere, and this goes some way to explaining the strength of their social media campaign.
Of course, this has only a slight correlation with the outcome of the election on Thursday, but it does show that the Conservative party have managed to generate a solid social media campaign (for Twitter) in the run up to the election, engaging better with their (larger number of) followers. Obviously, the numbers involved here are small relative to the size of the electorate, and to a certain extent their campaigns are preaching to the converted. This election will be won by convincing swing voters to vote for a party in key constituencies, and it will take more than Twitter or Facebook campaigns to do this.
Oh, and my prediction for the result? The Tories to take the largest share of the votes with a hung parliament overall. And the whole thing to begin again in under a year.
Friday, April 16, 2010
The UK election - a measured perspective
Now that I'm getting into the swing of the UK election, I've been having a look at the three parties's websites and assess how they're doing. Rather than the usual analysis of how the sites look and function, which has already been done here, I thought I'd do a quick post trying to see what tracking exists, and look at their social media strategy.
Analytics
On inspection of the websites tracking, using my Chrome extensions, it appears that all three are using Google Analytics, although none of them were using the the latest asynchronous version. Furthermore, there was no evidence of the code being tweaked. For the pages of the three sites that I visited, there was no evidence of any events being set up in Google Analytics, for example to track exit links, or people signing up to their email campaigns. There was also no sign of any custom variables being set when I carried out any significant actions (e.g. signing up for an email - I wasn't dedicated enough to this post to make any donations).
Social Media

The Labour website has a very basic set of social media links, pointing to just a Facebook page and their Twitter account.

The Conservative website has the most comprehensive set of links for its social media strategy, including ones to their Twitter account, Facebook fan page, YouTube Channel and iTunes podcast amongst others.

The Liberal Democrats website is more advanced than the Labour site in terms of its links, incorporating a YouTube channel link, but is not as comprehensive as the Conservatives.
However, just comparing what tools are used does not give an indication of how active their social media campaign is. We can have a snoop on how one element of their social media campaign is doing by looking at Twitalyzer (Super site by Mr Eric T Petersen - great review on its capabilities here) for the three parties.

The most noticeable chart here is the improving clout metric (the relative likelihood that the Twitter username will appear when searched for) which has been steadily rising, and is now rated at 80.7% for the last 30 days, indicating an increased presence in the last 30 days. The engagement metric (measuring the type of interaction the user has in Twitter by examining the ratio of people referenced by the user to the number of people referencing them) is 0%, and has registered no change over the last 30 days! This indicates that the account is referencing very few of the Twitterers who mention it - closer inspection of their account reveals that whilst they do reference others, a lot are the same account, and in no way match the RTs of their own account. The Tories (see next chart) suffer the same problem, although they have much higher Impact, Influence (similar to Clout, but looks at RTs and references) and Clout metrics. This indicates a higher number of followers (at currently c. 27k, nearly twice Labour's 15k), unique references and retweet rate amongst others.

Until yesterday, when the Liberal Democrat leader clearly won the leaders debate, the Liberal Democrats were very much in third place in this contest. Looking at their number of followers shows that whilst trailing the other two, the gap between them and Labour is very small.

Their Twitalyzer data shows a different picture, suggesting that their followers are more engaged than Labour's (although not as much as the Conservatives). On every metric bar Generosity (the share of tweets that retweet others) the Lib Dems trump Labour, suggesting their following are more likely to retweet and mention them than Labour's followers would them, and that they would be more likely to appear in a Twitter search. They manage a 0.5% engagement score, indicating they are doing a better job of talking to those that reference them.
Of course, all this references activity in the last 30 days - it is the next 30 days that are more important. However, looking at the trends and levels it would suggest that the Tories' larger number of Twitter followers are more engaged with them than their rival parties are, and that the Lib Dems and Labour are close, with the Lib Dems interacting better with their followers than the incumbent party. This then might have a bearing on future polls, and loosely corroborates the pre-debate polling suggesting a tentative Conservative lead. It also corroborates evidence that the Tories have a larger share of voters who are determined to vote and have made up their mind.
How these scores change in light of yesterday's debate and the events of the coming weeks are another matter, and one I hope to look at in the coming weeks. Let me know your thoughts on these numbers - what would you look at, and would you interpret the numbers differently?
Analytics
On inspection of the websites tracking, using my Chrome extensions, it appears that all three are using Google Analytics, although none of them were using the the latest asynchronous version. Furthermore, there was no evidence of the code being tweaked. For the pages of the three sites that I visited, there was no evidence of any events being set up in Google Analytics, for example to track exit links, or people signing up to their email campaigns. There was also no sign of any custom variables being set when I carried out any significant actions (e.g. signing up for an email - I wasn't dedicated enough to this post to make any donations).
Social Media

The Labour website has a very basic set of social media links, pointing to just a Facebook page and their Twitter account.

The Conservative website has the most comprehensive set of links for its social media strategy, including ones to their Twitter account, Facebook fan page, YouTube Channel and iTunes podcast amongst others.

The Liberal Democrats website is more advanced than the Labour site in terms of its links, incorporating a YouTube channel link, but is not as comprehensive as the Conservatives.
However, just comparing what tools are used does not give an indication of how active their social media campaign is. We can have a snoop on how one element of their social media campaign is doing by looking at Twitalyzer (Super site by Mr Eric T Petersen - great review on its capabilities here) for the three parties.

The most noticeable chart here is the improving clout metric (the relative likelihood that the Twitter username will appear when searched for) which has been steadily rising, and is now rated at 80.7% for the last 30 days, indicating an increased presence in the last 30 days. The engagement metric (measuring the type of interaction the user has in Twitter by examining the ratio of people referenced by the user to the number of people referencing them) is 0%, and has registered no change over the last 30 days! This indicates that the account is referencing very few of the Twitterers who mention it - closer inspection of their account reveals that whilst they do reference others, a lot are the same account, and in no way match the RTs of their own account. The Tories (see next chart) suffer the same problem, although they have much higher Impact, Influence (similar to Clout, but looks at RTs and references) and Clout metrics. This indicates a higher number of followers (at currently c. 27k, nearly twice Labour's 15k), unique references and retweet rate amongst others.

Until yesterday, when the Liberal Democrat leader clearly won the leaders debate, the Liberal Democrats were very much in third place in this contest. Looking at their number of followers shows that whilst trailing the other two, the gap between them and Labour is very small.

Their Twitalyzer data shows a different picture, suggesting that their followers are more engaged than Labour's (although not as much as the Conservatives). On every metric bar Generosity (the share of tweets that retweet others) the Lib Dems trump Labour, suggesting their following are more likely to retweet and mention them than Labour's followers would them, and that they would be more likely to appear in a Twitter search. They manage a 0.5% engagement score, indicating they are doing a better job of talking to those that reference them.
Of course, all this references activity in the last 30 days - it is the next 30 days that are more important. However, looking at the trends and levels it would suggest that the Tories' larger number of Twitter followers are more engaged with them than their rival parties are, and that the Lib Dems and Labour are close, with the Lib Dems interacting better with their followers than the incumbent party. This then might have a bearing on future polls, and loosely corroborates the pre-debate polling suggesting a tentative Conservative lead. It also corroborates evidence that the Tories have a larger share of voters who are determined to vote and have made up their mind.
How these scores change in light of yesterday's debate and the events of the coming weeks are another matter, and one I hope to look at in the coming weeks. Let me know your thoughts on these numbers - what would you look at, and would you interpret the numbers differently?
Wednesday, March 24, 2010
Free versus paid tools: A review
I've been mulling this one over for a while now. I've worked with paid and free tools before, but in my current role I use both Google and Yahoo Analytics on my company's sites. However, for all their strengths, there are some things that the free tools can't provide me with. Should I fork out the company's cash to bring in a paid solution? This post aims to provide an overview of the strengths of the various tools, look at the two sides in the paid / free tool discussions going on in the Digital Analytics world, and start me on the long process of making up my mind!
Free Tools
Some free tools are big players in the web analytics market. In the WAA 2009 Outlook Survey 30% of respondents used a free vendor solution, whilst a recent Forrester report stated that 53% of enterprises surveyed used a free solution as their primary tool, and 71% use one in some capacity.
There are currently two main players in the free tools market - Yahoo! Analytics and Google Analytics. The latter is freely available and the most popular free tool, being used to track 28% of all websites. Yahoo! Analytics is not so easy to acquire, and thus isn't so widespread. There are, of course, other free tools out there such as Woopra and GetClicky, which focus more on simple real-time reporting, and as such will be excluded from this post. Whilst the reporting available in Yahoo! Analytics is more advanced than Google Analytics, is it an "Enterprise Class" solution? What makes a tool "Enterprise Class"? I've spoken to a number of people who believe that Yahoo! Analytics is strong enough to compete with the paid tools out there; not many people would say the same of Google, at least for now.
First off, let's compare the two free tools. James Dutton has a fantastic post analysing the two. His analysis breaks the two tools into various categories, and scores them accordingly. Yahoo! comes out better than Google for most, quite often by a large amount. User management, code customisation, report bookmarking and filtering all fair better under Yahoo! than Google. However, Google has a much better support network, both in terms of documented help files, as well as forums and online guidance. Campaign tracking is also better for Yahoo! than Google, as is path analysis, and custom report design.
James' post is so comprehensive there's little, if anything, that needs to be added. In my experience Google is the more user-friendly of the two, although I've had more experience of it. However, Yahoo! Analytics real strength is its adaptability, allowing the user to amend reports on the fly, drill-down into the data and then link to related reports. With its limited help facilities it might take you a while to figure out how to do it, but once you have you're away.
When people talk about "Enterprise Class" solutions, what do they mean? Essentially the ability to tailor your tool to allow you to measure your data how you want to, be it custom segmentation, metrics or dimensions, or the reporting itself. In this post Eric Peterson discussed Google and Yahoo! Analytics, and concluded that "I don't think that Google Analytics is appropriate for free-standing use within the true enterprise". Yahoo! Analytics, however, "is an Enterprise-class solution," according to Eric, designed to support business with custom data collection, reporting and segmentation needs. Nevertheless, whilst Yahoo! may have the edge for the two main free tools, don't discount Google altoghether. Google have clear plans to become "Enterprise Class", and its improvement over the last few years has been astounding, moving from a basic tracking mechanism to a tool which is now pushing the boundaries of the industry, and forcing established companies to justify their fees, and in some cases catch up. Analytics intelligence, custom alerts, segmentation, advanced analysis, Mobile, custom variables - the list is long and distinguished. Whilst many tools have these features, no provider has released so much so quickly. And, true to Google's ethos, the tools are easy to use and interpret.
Paid Tools
So that's the free tools covered. But what distinguishes them from their paid competitors, other than the price tag? And just how important are these extra features?
A recent analysis by Forrester looked at the main players in the paid web analytics tools market, as well as the aforementioned free tools. Firstly they looked at the factors that respondents considered when selecting a vendor. The most important were: importance of data accuracy, and the flexibility of the tool, both in terms of servicing the business needs, and reporting - an enterprise tool!
They then took these factors and others, and ranked the various tools accordingingly. Briefly returning to the free tools, they ranked Yahoo! Analytics behind Google Analytics, although this was due solely to the product and corporate strategy weightings that they used; in terms or the current offering, Yahoo! was comfortably ahead of Google.
Returning to the paid tools, the big four (Omniture, Coremetrics, Unica and WebTrends) were ranked closely, and significantly ahead of the two free tools. They highlighted these tools' data handling, reporting and analysis, in addition to the ancillary marketing applications and plug-ins. Looking at the scores for these tools it is interesting how each have clear perceived strengths and weaknesses; there is no one clear winner from the list - all have at least one drawback. Furthermore, for each section there is either a clear winner, loser or both. If a company were just using this report to make their choice, it would be a simple matter of determining which category(ies) were most important to them and the choice would be clear(er).
Comparing the paid tools to the free ones for their current offerings (leaving out strategy rankings), it's clear that the paid tools are comfortably ahead of the free. However, the gap is smallest for the metrics, dimension & correlations and reporting categories. It's the data handling and service support that distinguish the two groups, where paying the money delivers the most return. Of course there are plenty of consultants out there who would be willing to help out with any technical implementation issues you may have for the free tools, no doubt for significantly less than the cost of an annual licence fee for a paid tool.
Let the fight commence
OK, so now we know the strengths and weaknesses of the different tools. The question is, does it pay to pay? We've looked at the two types of tools, now let's look at the two camps. On the one side of the fence are those who support the use of paid tools, claiming that the free ones just don't cut it. The powerful analysis engines that can be plugged into the main tool enable us to slice and dice the data in new and insightful ways, looking at non-aggregated data. Eric Peterson has recently been talking about the bifurcation of tools: Yahoo Analytics and/or Google Analytics are great for business users, but you need an enterprise tool (e.g Omniture Insights or WebTrends Visitor Intelligence) for the analyst to deliver really detailed insight. It's clear that these tools are more powerful than the free ones, and with the resource can deliver more insight than the free ones ever could. By combining a powerful tool with a free one, or setting up some simple dashboards in the powerful tool, companies can deliver the appropriate level of data to its employees.
On the other side there are those who claim that the free tools, whilst not being as powerful as the paid ones, provide the analyst with enough information. They state that it's as much about the quality of the analyst as the tool. The analyst needs to ask the right questions of the tool and correctly interpret the resulting data - simply exporting a data puke and mailing it out won't do anything, even if it did come out of a very flashy and expensive tool. In a recent post Avinash explains that setting up a powerful paid tool takes time, and you get a hobbled tool - you'll need to upgrade and get plugins to get all the information. This wastes time and money, and still won't present insights on a plate to you. Applying this to the 10/90 rule, if you've not got the resource to bring in a large enough analytical function that can manipulate these tools to the best of their ability, don't waste the money on an expensive tool.
Of course both Eric and Avinash have their reasons for being on their respective sides of the fence, for different reasons both would be out of a job if they didn't. In many ways though they agree with each other, but just choose to focus on different parts of the issue. No-one disputes that paid tools aren't better than the free tools, although, conversely, no-one would dispute that the free tools aren't catching up. The issue boils down to implementation and resource, both financial and human.
On the one hand, if a company has unlimited resource and cash, has the management in place to see through an effective implementation, and is not desperate for results, then the best route to take would be installing an expensive tool. Conversely, if a company has limited cash and human capital, little time or knowledge for installing and needs results straight away, it should be obvious what to do. Of course, most companies lie within these two extremes, so the decision is rarely that straightforward. What is clear though is that implementing a complicated web analytics tool is a drawn-out process, requiring not only the technical knowledge, but a great planning skills, and the full engagement of the various stakeholders involved. Simple it is not. To further complicate matters, you have to contend with the issue of trying to map what you need the tool to do to what it can do, not what you're told it can do. Unless you really know what your goals for the tool are, you risk being sold a pup.
Obligatory UK Naval-Gazing Section
At this point in a brief aside I'd like to focus on the UK, where web analytics has been acknowledged but not engaged yet for most companies. Obviously there are exceptions, and the blue-chips here are ahead of the rest of us. But the fact remains that for most companies, senior management are aware of web analytics and the power it has to drive through change and appreciate the need to investigate it, but have not been convinced of the benefits of fully implementing it. Most companies don't have a full time web analyst, let alone a team, and haven't allocated the money to buy in a tool. This will happen, but we are still at an early stage in the cycle. Effectively we are being asked to prove what can be done with a free tool before we shell out £££s on something better.
So what's the conclusion to all this? As any guru or university student will tell you, the correct answer is "it depends". If you've got the resources (money and people) to justify a paid tool, then you might reap the benefits as part of a medium to long term plan to improve the analytics of your company. But it requires dedication, good management and focus to pull this off. I've seen companies falter with their paid solution as the implementation has let them down, and people drown in the data and data issues. Focus on the human capital first, and apply the most suitable tool to it to derive the insight we all crave.
Free Tools
Some free tools are big players in the web analytics market. In the WAA 2009 Outlook Survey 30% of respondents used a free vendor solution, whilst a recent Forrester report stated that 53% of enterprises surveyed used a free solution as their primary tool, and 71% use one in some capacity.
There are currently two main players in the free tools market - Yahoo! Analytics and Google Analytics. The latter is freely available and the most popular free tool, being used to track 28% of all websites. Yahoo! Analytics is not so easy to acquire, and thus isn't so widespread. There are, of course, other free tools out there such as Woopra and GetClicky, which focus more on simple real-time reporting, and as such will be excluded from this post. Whilst the reporting available in Yahoo! Analytics is more advanced than Google Analytics, is it an "Enterprise Class" solution? What makes a tool "Enterprise Class"? I've spoken to a number of people who believe that Yahoo! Analytics is strong enough to compete with the paid tools out there; not many people would say the same of Google, at least for now.
First off, let's compare the two free tools. James Dutton has a fantastic post analysing the two. His analysis breaks the two tools into various categories, and scores them accordingly. Yahoo! comes out better than Google for most, quite often by a large amount. User management, code customisation, report bookmarking and filtering all fair better under Yahoo! than Google. However, Google has a much better support network, both in terms of documented help files, as well as forums and online guidance. Campaign tracking is also better for Yahoo! than Google, as is path analysis, and custom report design.
James' post is so comprehensive there's little, if anything, that needs to be added. In my experience Google is the more user-friendly of the two, although I've had more experience of it. However, Yahoo! Analytics real strength is its adaptability, allowing the user to amend reports on the fly, drill-down into the data and then link to related reports. With its limited help facilities it might take you a while to figure out how to do it, but once you have you're away.
When people talk about "Enterprise Class" solutions, what do they mean? Essentially the ability to tailor your tool to allow you to measure your data how you want to, be it custom segmentation, metrics or dimensions, or the reporting itself. In this post Eric Peterson discussed Google and Yahoo! Analytics, and concluded that "I don't think that Google Analytics is appropriate for free-standing use within the true enterprise". Yahoo! Analytics, however, "is an Enterprise-class solution," according to Eric, designed to support business with custom data collection, reporting and segmentation needs. Nevertheless, whilst Yahoo! may have the edge for the two main free tools, don't discount Google altoghether. Google have clear plans to become "Enterprise Class", and its improvement over the last few years has been astounding, moving from a basic tracking mechanism to a tool which is now pushing the boundaries of the industry, and forcing established companies to justify their fees, and in some cases catch up. Analytics intelligence, custom alerts, segmentation, advanced analysis, Mobile, custom variables - the list is long and distinguished. Whilst many tools have these features, no provider has released so much so quickly. And, true to Google's ethos, the tools are easy to use and interpret.
Paid Tools
So that's the free tools covered. But what distinguishes them from their paid competitors, other than the price tag? And just how important are these extra features?
A recent analysis by Forrester looked at the main players in the paid web analytics tools market, as well as the aforementioned free tools. Firstly they looked at the factors that respondents considered when selecting a vendor. The most important were: importance of data accuracy, and the flexibility of the tool, both in terms of servicing the business needs, and reporting - an enterprise tool!
They then took these factors and others, and ranked the various tools accordingingly. Briefly returning to the free tools, they ranked Yahoo! Analytics behind Google Analytics, although this was due solely to the product and corporate strategy weightings that they used; in terms or the current offering, Yahoo! was comfortably ahead of Google.
Returning to the paid tools, the big four (Omniture, Coremetrics, Unica and WebTrends) were ranked closely, and significantly ahead of the two free tools. They highlighted these tools' data handling, reporting and analysis, in addition to the ancillary marketing applications and plug-ins. Looking at the scores for these tools it is interesting how each have clear perceived strengths and weaknesses; there is no one clear winner from the list - all have at least one drawback. Furthermore, for each section there is either a clear winner, loser or both. If a company were just using this report to make their choice, it would be a simple matter of determining which category(ies) were most important to them and the choice would be clear(er).
Comparing the paid tools to the free ones for their current offerings (leaving out strategy rankings), it's clear that the paid tools are comfortably ahead of the free. However, the gap is smallest for the metrics, dimension & correlations and reporting categories. It's the data handling and service support that distinguish the two groups, where paying the money delivers the most return. Of course there are plenty of consultants out there who would be willing to help out with any technical implementation issues you may have for the free tools, no doubt for significantly less than the cost of an annual licence fee for a paid tool.
Let the fight commence
OK, so now we know the strengths and weaknesses of the different tools. The question is, does it pay to pay? We've looked at the two types of tools, now let's look at the two camps. On the one side of the fence are those who support the use of paid tools, claiming that the free ones just don't cut it. The powerful analysis engines that can be plugged into the main tool enable us to slice and dice the data in new and insightful ways, looking at non-aggregated data. Eric Peterson has recently been talking about the bifurcation of tools: Yahoo Analytics and/or Google Analytics are great for business users, but you need an enterprise tool (e.g Omniture Insights or WebTrends Visitor Intelligence) for the analyst to deliver really detailed insight. It's clear that these tools are more powerful than the free ones, and with the resource can deliver more insight than the free ones ever could. By combining a powerful tool with a free one, or setting up some simple dashboards in the powerful tool, companies can deliver the appropriate level of data to its employees.
On the other side there are those who claim that the free tools, whilst not being as powerful as the paid ones, provide the analyst with enough information. They state that it's as much about the quality of the analyst as the tool. The analyst needs to ask the right questions of the tool and correctly interpret the resulting data - simply exporting a data puke and mailing it out won't do anything, even if it did come out of a very flashy and expensive tool. In a recent post Avinash explains that setting up a powerful paid tool takes time, and you get a hobbled tool - you'll need to upgrade and get plugins to get all the information. This wastes time and money, and still won't present insights on a plate to you. Applying this to the 10/90 rule, if you've not got the resource to bring in a large enough analytical function that can manipulate these tools to the best of their ability, don't waste the money on an expensive tool.
Of course both Eric and Avinash have their reasons for being on their respective sides of the fence, for different reasons both would be out of a job if they didn't. In many ways though they agree with each other, but just choose to focus on different parts of the issue. No-one disputes that paid tools aren't better than the free tools, although, conversely, no-one would dispute that the free tools aren't catching up. The issue boils down to implementation and resource, both financial and human.
On the one hand, if a company has unlimited resource and cash, has the management in place to see through an effective implementation, and is not desperate for results, then the best route to take would be installing an expensive tool. Conversely, if a company has limited cash and human capital, little time or knowledge for installing and needs results straight away, it should be obvious what to do. Of course, most companies lie within these two extremes, so the decision is rarely that straightforward. What is clear though is that implementing a complicated web analytics tool is a drawn-out process, requiring not only the technical knowledge, but a great planning skills, and the full engagement of the various stakeholders involved. Simple it is not. To further complicate matters, you have to contend with the issue of trying to map what you need the tool to do to what it can do, not what you're told it can do. Unless you really know what your goals for the tool are, you risk being sold a pup.
Obligatory UK Naval-Gazing Section
At this point in a brief aside I'd like to focus on the UK, where web analytics has been acknowledged but not engaged yet for most companies. Obviously there are exceptions, and the blue-chips here are ahead of the rest of us. But the fact remains that for most companies, senior management are aware of web analytics and the power it has to drive through change and appreciate the need to investigate it, but have not been convinced of the benefits of fully implementing it. Most companies don't have a full time web analyst, let alone a team, and haven't allocated the money to buy in a tool. This will happen, but we are still at an early stage in the cycle. Effectively we are being asked to prove what can be done with a free tool before we shell out £££s on something better.
So what's the conclusion to all this? As any guru or university student will tell you, the correct answer is "it depends". If you've got the resources (money and people) to justify a paid tool, then you might reap the benefits as part of a medium to long term plan to improve the analytics of your company. But it requires dedication, good management and focus to pull this off. I've seen companies falter with their paid solution as the implementation has let them down, and people drown in the data and data issues. Focus on the human capital first, and apply the most suitable tool to it to derive the insight we all crave.
Subscribe to:
Posts (Atom)


